DOWNLOADS · CPU CAPTURE · 2026-07-27
Source & profiler artifacts
This page provides the published source code, input datasets, generated outputs, and
CPU profiling artifacts used throughout the runtime evaluation. The profiler artifacts
include both raw execution traces and derived analysis reports.
View the complete project source on GitHub
Published scope.
This archive includes the example applications, profiler artifacts, and the brightness
operation definition used in the JIT fusion evaluation. Internal runtime sources,
generated registries, and JIT backend implementation files are not part of the published
artifact set.
ISP and test application source
| File | Description |
|---|
| main.c |
Persistent graph ISP example |
| main_alt.c |
Single-frame ISP pipeline used for the primary CPU profile |
| main_test.c |
Image operation example demonstrating fusion, reshape, and cast operations |
| util/util.h |
RAW unpacking, gamma correction, CCM utilities, and output helpers |
| util/stb_image.h |
Bundled image loading library |
| util/stb_image_write.h |
Bundled image writing library |
Streamed financial-data source
| File | Description |
|---|
| order_book/main.c |
Persistent tensor graph over live, batched order-book snapshots |
| util/producer.c |
Parallel WebSocket ingestion, parsing, and snapshot assembly |
| util/queue.c |
Lock-free SPSC circular-buffer implementation |
| util/queue.h |
SPSC queue layout and internal interface |
| util/util.c |
Timing and compact pipeline reporting |
| util/util.h |
Stream API, snapshot layout, and benchmark configuration |
Operation definition
| File | Description |
|---|
|
brightness.op
|
Brightness operation written in the runtime DSL and used for the JIT fusion evaluation
|
|
matrix_mul.op
|
Matrix multiplication operation definition used to show the compiler-to-library path
|
|
microprice.op
|
Batched order-book microprice operation |
|
orderbook_imbalance.op
|
Bid/ask quantity imbalance operation |
|
slippage.op
|
Order-book execution slippage operation |
|
visible_matrix_mul.txt
|
Complete visible compiler trace: parsing, specialization, generated C, LLVM bitcode, and registry output
|
Streamed financial-data plots
| Artifact | Description |
|---|
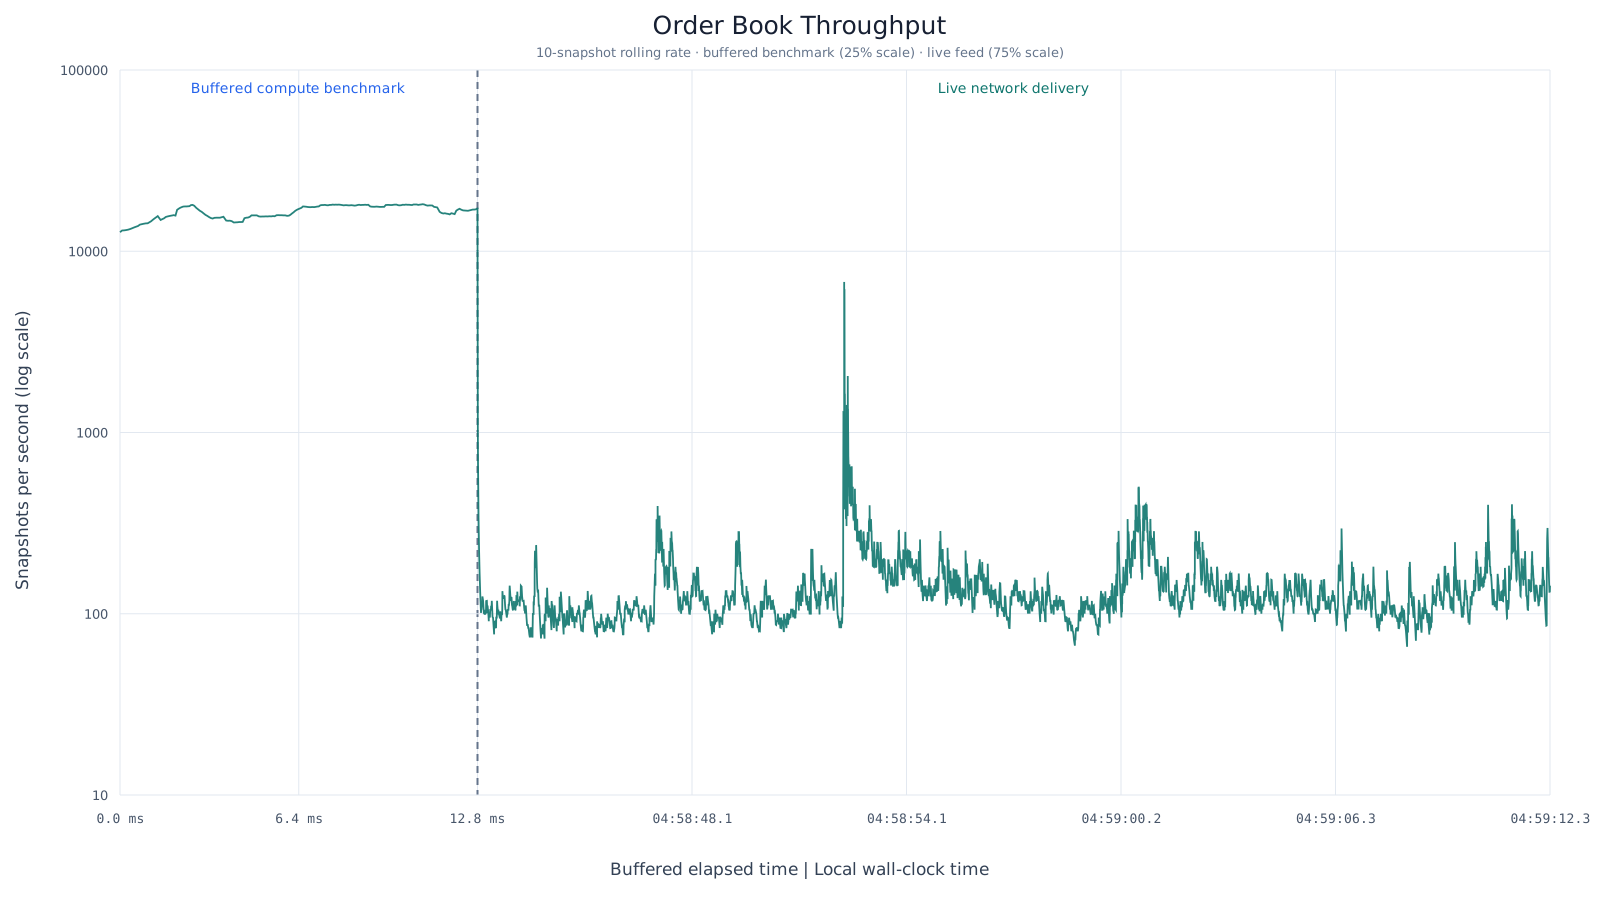
| throughput.svg |
Buffered compute capacity and live-feed throughput on a shared scaled timeline |
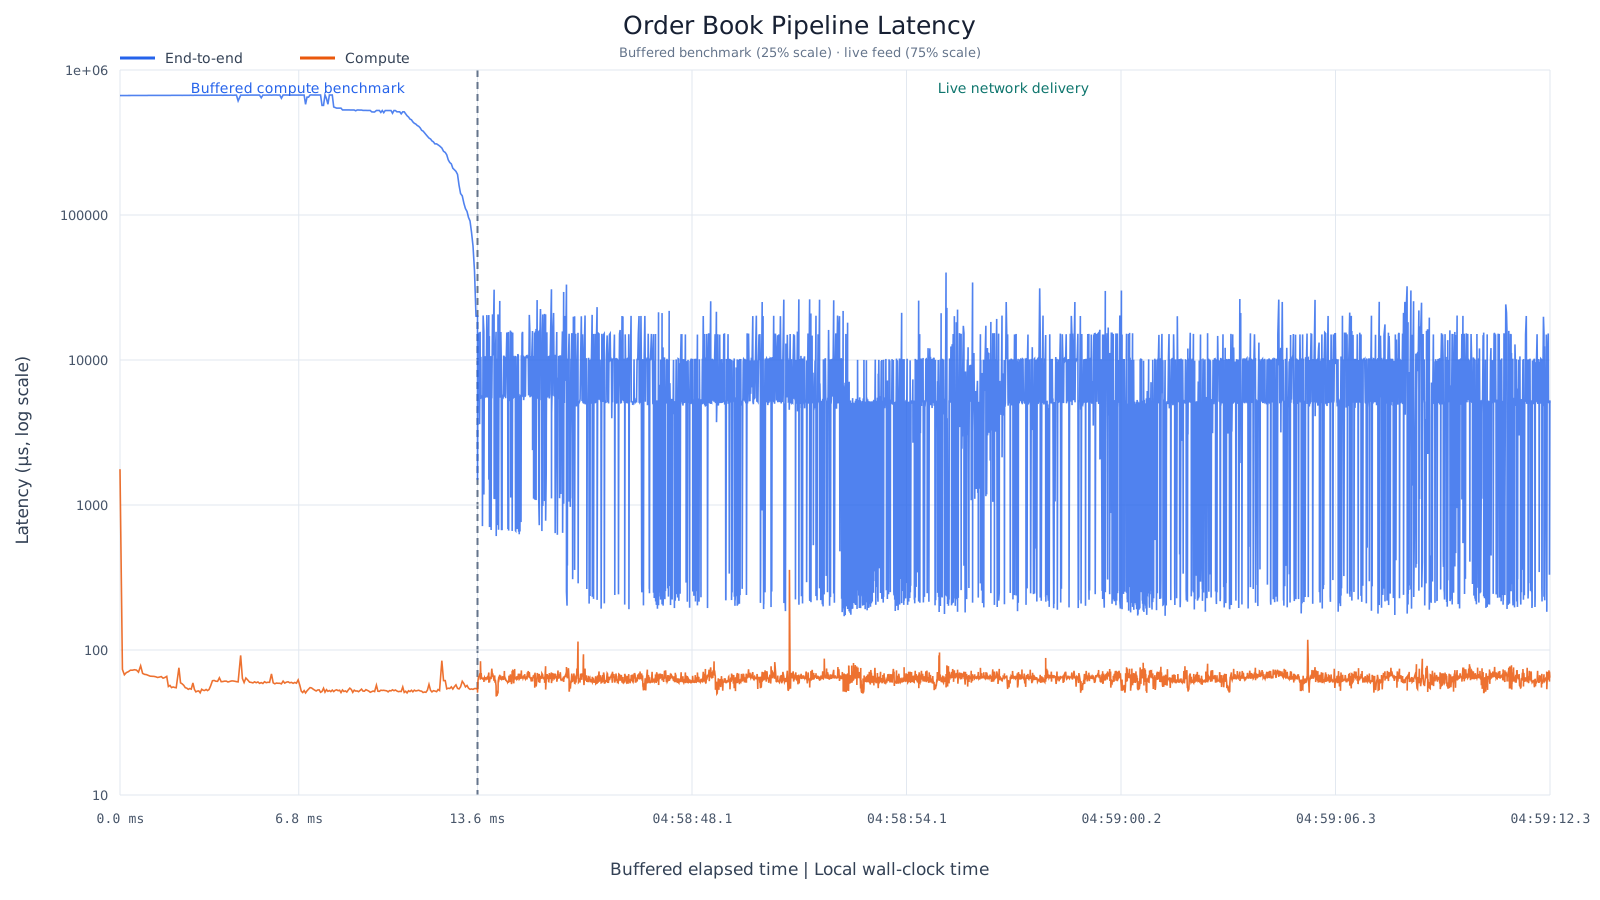
| latency.svg |
Compute and end-to-end latency across buffered and live phases |
Inputs and generated outputs
Full ISP profiler capture (CPU backend)
Persistent graph profiler capture (CPU backend)
Fusion test profiler capture (CPU backend)